
The second round of the #SciFund Challenge is open for business – sign up here!
So, Jarrett and I have been analyzing the data from the first round of #SciFund to determine the money patterns in science crowdfunding (check out Jarrett’s earlier posts here and here). This time, let’s drill down a bit to see what we can learn about those who contributed to #SciFund projects.
1. #SciFund scientists basically brought their own contributors to their projects.
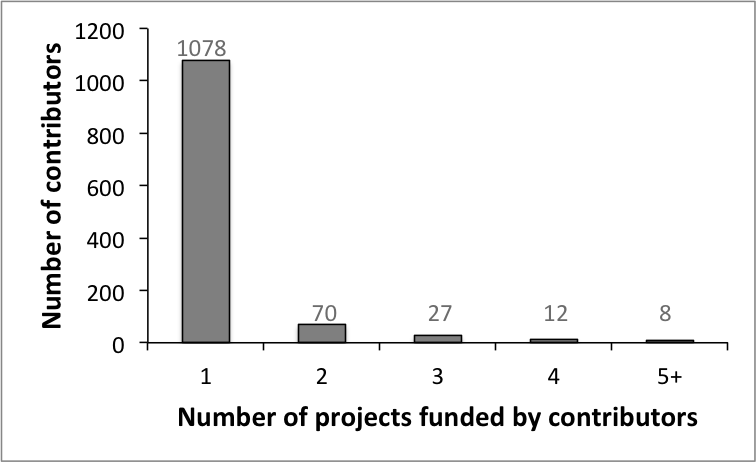
The above graph shows the frequency distribution of the number of projects funded by each contributor. There were 1196 total contributors to #SciFund projects and 1079 of them (90.2%) gave to one project. The contributors who gave to multiple projects mostly gave to two projects, though some folks spread their cash far and wide (including one person who gave to an incredible 16 projects!).
The most likely explanation for this distribution pattern, to my mind anyway, is that #SciFund scientists by and large brought their own set of contributors – contributors who mostly didn’t contribute to anyone else. The combined “tailwind effect” of being part of #SciFund and of being on a popular crowdfunding site (RocketHub) was very real, but nonetheless not the major determinant of contributors (since 9.8% percent of donors gave to multiple projects).
There is an alternate explanation of this pattern which gives a bigger role to this tailwind effect (#SciFund and RocketHub). It is almost certainly true that an unknown percentage of “one-timer” contributors came to the #SciFund project pages due to the extra publicity given by #SciFund and RocketHub, gave to the first project that they liked, and then said, “I’m done.” Unfortunately, this set of people is impossible to distinguish from those who gave to only one project because of the efforts of the scientist behind that project.
2. 20 and 25 dollars were magic numbers.
The contributions given to #SciFund projects ranged in size from one dollar to an incredible 1360 dollars. However, the median amount given to a #SciFund project was 25 dollars, if the contributor gave to only project. If a contributor gave to multiple projects, that median amount given to a single project dropped to 20 dollars (multiple and single contributors differed in a statistically significant way in their pattern of contribution). However, the overall contribution, across all #SciFund projects of these multiple givers was 50 dollars (median amount). Note, that though there were a few people (29) who donated multiple times to a single project, I ignored this fact by just summing together total contributions per contributor to each project.
3. Projects were largely fueled by larger contributions.
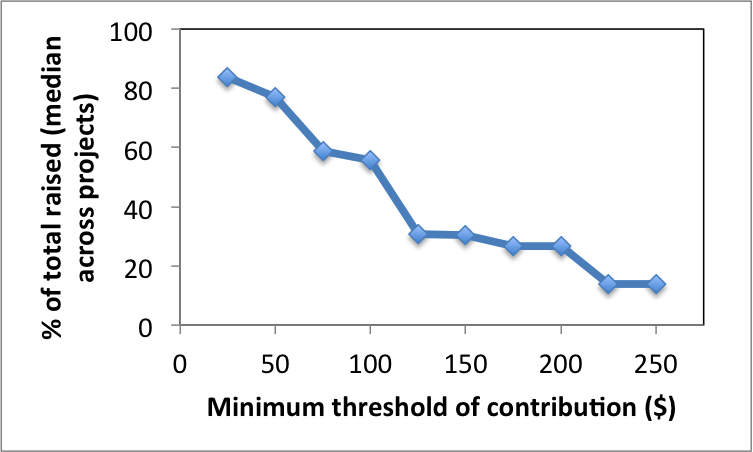
The above graph will take a little bit to explain. For any particular project, we can ask, if we throw out all contributions below a certain dollar threshold, what percentage of the original total amount remains? We can go further and ask, for a whole bunch of thresholds, what is the the percentage of the total amount remaining (the median percentage across all projects). What we see here in this graph is that, even though the median contributions were 20 and 25 dollars (for multiple-contributors and single-contributors, respectively), most of the money for projects came in larger chunks. In fact, most of the money for projects came in contributions of one hundred dollars and more. This shows that the few contributors who gave big amounts played really outsized roles in the financial success or failure of projects.
4. The more contributors a project had, the more money was raised.
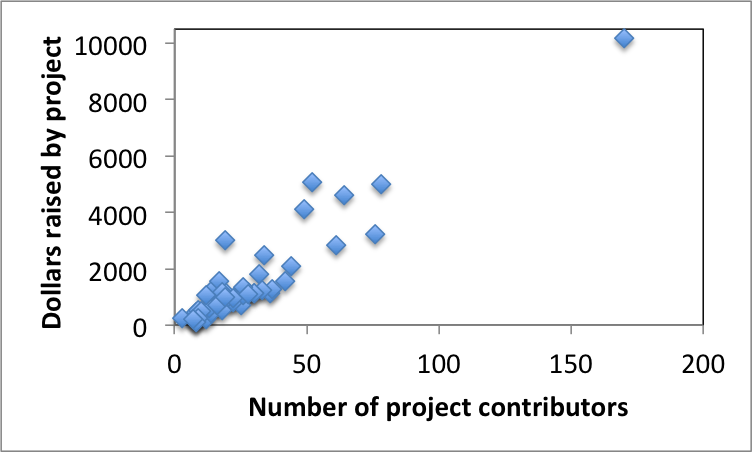
The number of contributors to an individual project ranged from 3 to 170. The above graph shows that there is a strong correlation between the number of project contributors and the dollars raised by that project (and it is a very statistically significant correlation to boot).
Point 2. I ran a Mann-Whitney U test to determine whether the distribution of contributions differed between single-contributors and multiple-contributors. The two distributions differed in a statistically significant way (U = 232999, p < 2.2 x 10⁻¹⁶).
Point 4. I calculated Spearman’s rank correlation between the number of project contributors and the dollars raised by a project. These two variables were strongly positively correlated (correlation = 0.86, p = 1.56 x 10⁻¹⁵).


a) Excel?! AIEEEE!!! (sorry, couldn’t help myself)
b) in analysis 3, you say “if we throw out all contributions below a certain dollar threshold, what percentage of the original total amount remains” – and the graph shows that if you throw out all contributions below $250, the project success is around 20%. I’d say that means that small donors were ESSENTIAL. In fact, if you throw ou everything below $50, you drop success by 40%. There’s a sharp transition at $100, so, clearly those $100 donors were pretty key, but a 40% loss is nothing to sneeze at. I’m not 100% convinced this is the best way of getting at that question – perhaps a look at the number of donors GREATER than a certain donation versus success and/or total raised might be clearer. rgh – need to finish these paper revisions so I can get back to this!
c) The graph in figure 4 still makes my jaw drop.
d) Hello, everyone! Welcome to collaborative science being done in the open! By ecologists doing social science!