
All right, I know #SciFund Round 2 has been announced, but let’s continue our dig into the data from Round 1! Last time we showed that goal kinda sorta maybe helps determine the success of one’s project. Today were going to look at a different question – is how much money you pull in just determined by the number of people you get looking at your stuff.
So, we’ll be talking in terms of $$, nor just % success. I’ll save that for another post (there’s more than enough here!)
Fortunately, the kindly folks at RocketHub provided us with the hit stats for each project, so we know the daily number of hits for each project. And there is a HUGE spread in hit numbers – from 292 views all the way to 38,131. Yep, it’s kind of a huge span.
So let’s begin like last time and just look at the relationship between # of pageviews and total amount raised. I’m going to throw up two plots, because as you’ll see, that 38,131 project was a huge outlier, so it makes it hard to see what’s going on with the rest of the data.
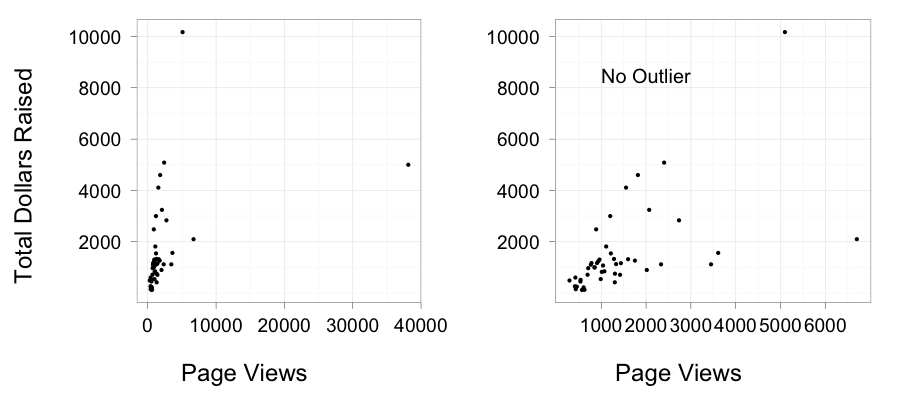
So, the trend is interesting. For most of the data, it appears pretty linear. This is no surprise as, honestly, no pageviews = no $. Heck, it even begs the question, does 1 view = $1?
The outlier is a leedle problematic. Because it’s two orders of magnitude further out on the x-axis than the nearest other point, it’s going to have a HUGE effect on any statistical fit. We also know that the particular outlier in question had some unique things going for it.
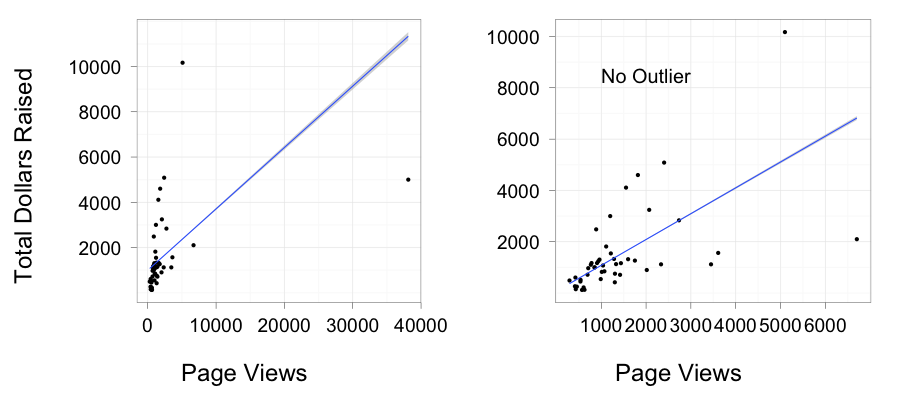
Because of this, it seems prudent to model this relationship both with and without the outlier. We can also question whether this whole relationship is truly linear, or perhaps it is nonlinear as well – sure, 0 views = 0 dollars, but there still might be something nonlinear going on here. Given what we saw with the Goal analysis, maybe there’s some multiplicative effect of views here – an exponential model.
OK, first, linear or not? To answer that, I fit two different generalized linear models. As it is not possible to have negative dollars, and that dollars are de facto count data, I used a poisson error distribution (quasipoisson didn’t change anything) and a linear and log link. I also forced both relationships through 0 at the intercept. The results were pretty striking – the difference in AIC was 803885.1 favoring the linear model.
So how good was the fit? TERRIBLE! only 16% of the variation in the data was retained in the model (the R2 between the observed and fitted values). What could be making this so bad? Well…
I repeated the analysis without the outlier, which I do have good reason to exclude (although the data scientist in me wants to have a sufficient model that would explain it just fine…). Here again we have a big difference in AIC scores that heavily favors the linear model (a difference of 497776.3).
Coefficients:
          Estimate Std. Error z value Pr(>|z|)
Pageviews 1.058197   0.004001   264.5   <2e-16 ***
---
Signif. codes:  0 ‘***’ 0.001 ‘**’ 0.01 ‘*’ 0.05 ‘.’ 0.1 ‘ ’ 1
Roughly, 1 hit, $1. Huh.
But what about the fit? Eh, it’s better. About 33% of the variation in the data is retained by the model. So…meh. Kinda OK, but not great.
One question that comes up, though, is that – particularly for successful projects – pageviews after achieving one’s goal may actually be worth less than those that come before a goal is reached. I mean, let’s say you surf over to a project, wallet open, only to see that, hey, a goal has been achieved. Personally, unless there was a compelling reason, at that point I’d say “Good on ya!” and move on.
So, granted, we have only a subset
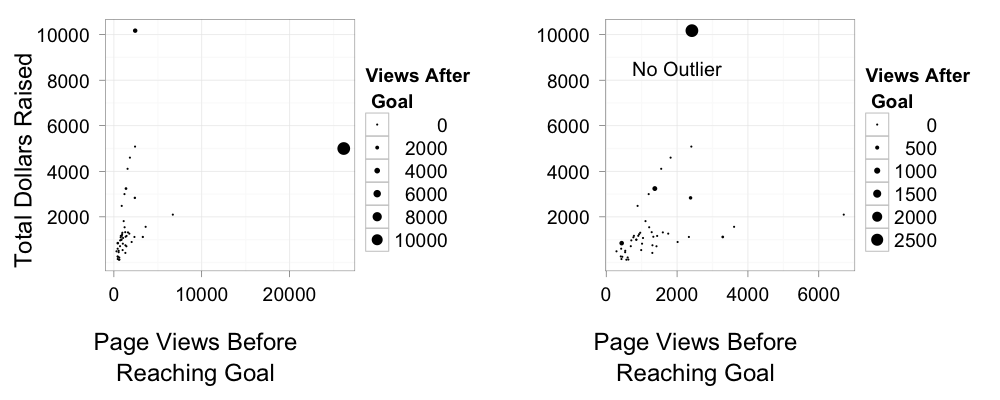
Again, we see the outlier being totally odd. I had honestly thought that splitting pre and post would move the outlier back in line. I even tried defining pre- as the day BEFORE a project hit 100%, but, nope, it persists. This project just kept on truckin’, and once it hit its inflection point, it took 2 days to reach 100%. Weird.
And, honestly, the model fit with the outlier in it makes very little sense – it fits extremely poorly (9% of the variation is retained), so, I’m just going to skip straight on to the no outlier analysis. And, indeed, it doesn’t even fit properly unless I jigger the model a bit because the outlier causes pre- and post- views to be VERY highly correlated – a pearson correlation of 0.94. Dropping the outlier reduces that correlation in the data to 0.147.
So, onwards with the no outlier analysis. The results are pretty darned intriguing:
Coefficients:
                  Estimate Std. Error z value Pr(>|z|)
preGoalPageviews  0.959819   0.004154  231.07   <2e-16 ***
postGoalPageviews 2.396329   0.028944   82.79   <2e-16 ***
---
Signif. codes:  0 ‘***’ 0.001 ‘**’ 0.01 ‘*’ 0.05 ‘.’ 0.1 ‘ ’ 1
Contrary to my hypothesis, pageviews after hitting one’s target goal actually appear MORE valuable that pageviews before hitting one’s goal. Pre-Goal views are still ~ $1 per view. But after you hit 100%, that appears to jump to roughly $2.40 per view. Basically, success begets success. And the relationship is actually half-way decent. It retains about 53% of the variation in the data. Not bad, really.
But, to leave things on a less clear note, a) what drives someone to that ‘success’ point? And b) that outlier is still there, haunting me. Can we build a better model that will fold it in?
Other thoughts?
Oh, and as always, code!


Can I ask what the outlier project is with the insane amount of hits? I mean, why did that project get so many hits? Was its video included in an overarching SciFund post that got circulated broadly (and thus hits are actually being driven to SciFund by way of the project in question, rather than specifically to the project itself)?
Sorry, nope. Human subjects. We can’t give away identifying information.
Boo, ethics. 😉 Thanks for these posts. I’m really enjoying them (and in the process of recruiting a colleague to do round 2…)!
Any idea how these numbers compare with normal projects on rockethub?
For the dollars per click, we were in the ballpark for their other projects. They hadn’t done the pre-post success analysis, though, so unclear on that one.