
So, we have now completed three rounds of #SciFund! WOOHOO! The question that will now come up is, how did we did? Is science crowdfunding on the rise? How does this round stack up, and what can we learn?
In the coming days and weeks, we’ll be crunching the data (not the least of which because our reviewers on the #SciFund paper wanted more data) and providing it back to you. But, some quick summary statistics. First off, extending Dr. Zen’s Round by Round analysis of R2, we have this summary table.
| Round | Days | Projects | Projects funded at 100% | Percent funded at 100% | Total raised |
| 1 | 45 | 49 | 10 | 20.4% | $76,230 |
| 2 | 31 | 75 | 33 | 44.0% | $100,345 |
| 3 | 33 | 35 | 16 | 45.7% | $75,978 |
| Overall | 159 | 59 | 37.1% | $252,811 |
The thing that leaps out to me is that with fewer people, and less time, we raised almost as much as R1. Astounding! Our project 100% success rate (which doesn’t tell the whole story, as many projects hit 70-80% as well) has gone up a teensy bit from round 2. We’re almost at 50%!
Furthermore, we have to date raised just over one quarter of a million dollars. That, frankly, blows me away.
But those stats don’t quite tell the whole story. How are individual projects doing? Also, each round was of a different length, so if we want to get an accurate picture of how things are growing and changing, we need to correct for length of round. So, let’s take a look, shall we?
| Round | Project Average | Daily Average | Project Median | Daily Median |
| 1 | 1555.71 | 34.57 | 1104 | 24.53 |
| 2 | 1341.37 | 43.27 | 1046 | 33.74 |
| 3 | 2170.80 | 65.78 | 1440 | 43.64 |
Both the overall project average and median have increased by a good bit. Encouraging. When we correct for length of the round, the story gets even more interesting. The daily average and median donation to projects has nearly doubled since R1. Here’s a quick visual so that you can see more of what the data looks like:
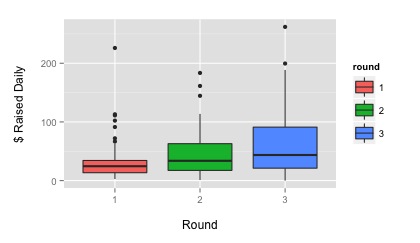
What’s intriguing here (in addition to the upward trend) is that our outlier points for daily contribution have moved up – on a daily basis, our most successful projects are bringing in even more than they did in R1. Of course, to be fair, Kristina’s project in R1 raised that amount quickly – well within the 33 day timeline of R3. For some additional comparison, let’s look at the amount raised in two ways – first a box and whisker plot, and then a plot of the individual data points jittered a little left and right for clarity.
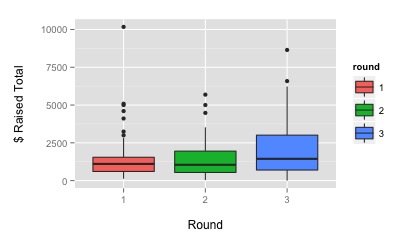
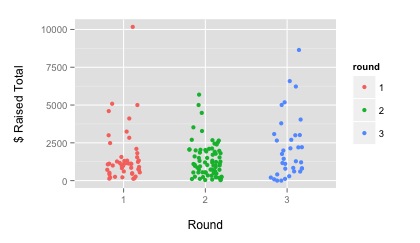
This last figure really blows me away. More projects are raising >$5000. More projects are lifting out of the low hundreds zone. It’s onwards and upwards, as you wonderful beautiful scientists expand your skills and horizons as fabulous communicators, and make that translate into funding for your science.
As always, I’m truly humbled by what you all create, and cannot wait to see what is next!
FYI: code for this analysis with some data can be found here.
There were 35 projects “on the screen” when you went to the RocketHub page for this round. Two of them did not take you to a project when you clicked on them, however. They were shut out, with zero dollars raised. They are not included in my dataset in Figshare, which can be found here: http://dx.doi.org/10.6084/m9.figshare.104620
If we exclude those, we funded 48% of projects – so close to half!
Huh. Indeed, I polled from the list Rockethub gave to me. Not sure what was up with those two…but perhaps they should be dropped from the analysis. I did contact those project authors to see if they needed any help, but never heard back.
Folks,
I have a project that needs funding. I would like to know how to submit it for consideration.
Thanks
Reay
Great! We don’t have a round currently running. But, you can still post projects to a variety of crowdfunding sites out there. Feel free to use our materials here as a guide.