For this post, I’ve got some data on the social “buzz” around #SciFund.
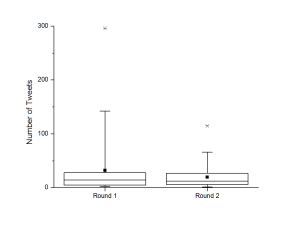
The number of times projects were tweeted were roughly the same. These tweets were taken from the RocketHub page for each project, and doesn’t include tweets people may have made by sticking the link directly into Twitter or some other URL shortener. (You can click to enlarge.) This shows the trend that the number was higher for Round 1, but much of that is driven by “breakout” projects as outliers.

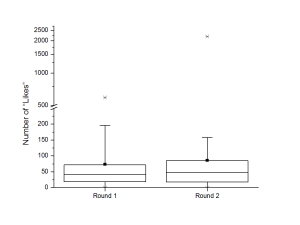
The number of Facebook “likes” for projects has a crazy outlier in Round 2 rather than Round 1 (note the break in the Y axis). Again, these were people hitting the “Like” button on the RocketHub page for each project, so would be an underestimate of the coverage on Facebook. (But at least it’s a consistent underestimate.)

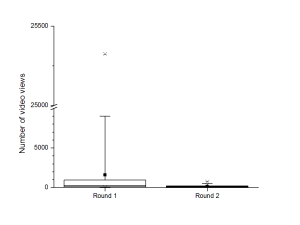
The video views for the two rounds are the hardest to compare. I knew that there was going to be an outlier in round 1 – the “Duck Force” video (hey, explosive eversion of duck penises is what the Internet was made for) – but this was one where there seemed to be the biggest difference. Remember, the boxes show where 50% of the data sit. The most popular videos in round 2 were just around the median number of video views for round 1.

We raised more money in round 2, but if anything, the social media measures seem to say that round 1 attracted slightly more attention, if anything. The mystery of the success of round 2 deepens. How did we do it?


I still think we may need to remember that round 2 was 15 days shorter – so, with 15 fewer days, projects received the same amount of attention. I think that’s a win!