Now that we’ve had a few days to catch up from the astonishing finish of the second round of #SciFund, I’m going to do a few posts comparing some of the basic stats between round 1 and round 2.
The basics:
| Round | Days | Projects | Projects funded | Percent funded | Total raised |
| 1 | 45 | 49 | 10 | 20.4% | $76,230 |
| 2 | 31 | 75 | 33 | 44.0% | $100,345 |
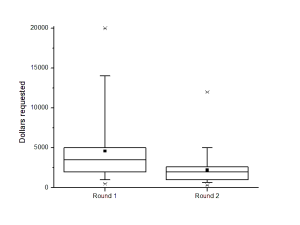
Here’s a comparison of how much researchers started out trying to raise; the targets for their projects. Click to enlarge:

(You’ll see a few graphs like this. The small black square is the mean. The box shows where 50% of the values fall, and the line dividing the box in two is the median. The whiskers show where 95% of the data is, and the little stars show the biggest and smallest values.)
Round 2 participants were not asking for as much cash as those in the first round. This might be because after round 1, participants had a better idea of what could be raised by crowdfunding.


3 comments on “Round by round: Part 1”Add yours →
Comments are closed. You can not add new comments.