UPDATE: Thanks to the keen eyed Dr. Zen, I would like to add one caveat to my conclusions below. Every single project that asked for less than $1250 was fully funded. So, ponder that as you read the below. I’ve also edited a bit to reflect this.
Today, we begin our series of posts analyzing data from the #SciFund challenge participants. Today, I begin my first jump deep into the heart of non-ecological data analysis. Today, we begin to get some answers, and raise some deeper questions (and you should ask them.) Today, we test hypothesis #1, a null of sorts – Your success depends solely on how much money you ask for.
OK, I admit, I really wanted to write, “Today, I am a man.”
What, I’m working outside of my comfort zone, here! Anyway…
One of the first questions that inevitably comes up when talking to people about #SciFund is, “So, how much money can I raise?” When Jai and I began this venture, we encouraged folk to start small. We had no idea if crowfdunging for science could work, and we didn’t want anyone to try and, say, fund their annual salary on it, or put the fate of their entire lab in the hands of the crowd.
Start small.
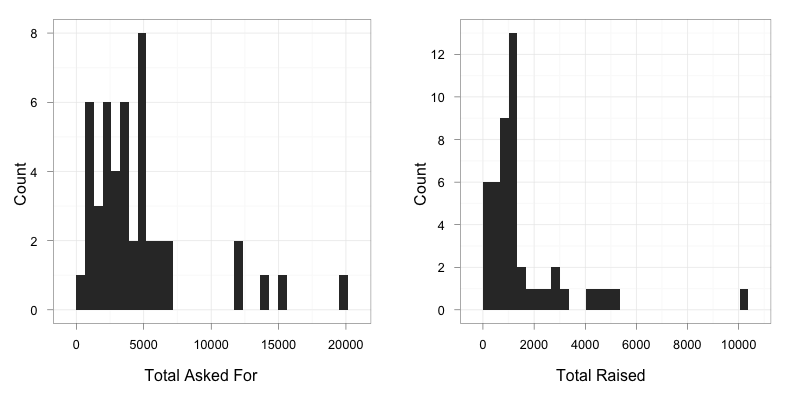
That said, we got a pretty big spread of Goals. The median goal was $3500, and the max was $20K. From a data perspective, this is great, as we can really look at the relationship between Goal and Success. First, some basics.
Taking our first gander at the data, we can see that while the distribution of goals was definitely skewed towards the left – most things were typically less than $7,500, the distribution of total raised is even more skewed – most projects raised less than $4,000. Indeed, the mean of what was raised is about $1594.68 and the median is $1120. Perfect for a grad student project, no?
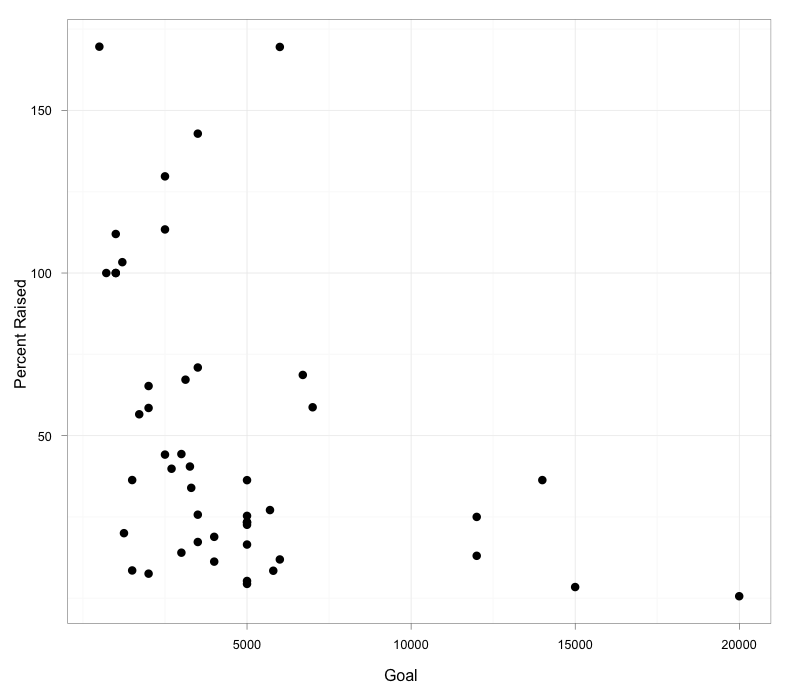
OK, but what about success? We can start by looking at the relationship between goal and % success. And there’s some interesting stuff here.
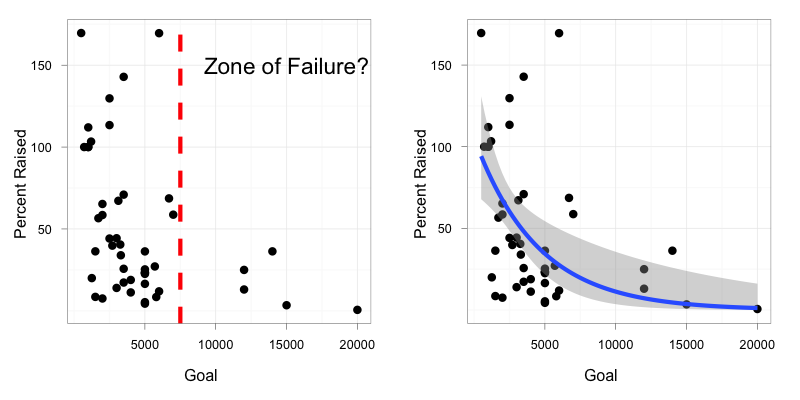
Immediately, three trends leap out. The first is that, again, if you asked for more than that $7500 margin or so, your success rate, in general was pretty low. At the same time, there’s a huge amount of scatter at the less than $7500 level. So much, really, that it seems like amount asked for is a terribly predictor or success. And third, and perhaps most important, all projects that asked for less than $1250 succeeded. (Thanks, Dr. Zen!)
Oddly, the relationship between project goal and success totally looks like graphs I produce looking at the relationships between kelp and urchin abundance. Weird.
This graph suggests two things – either there is a relationship that is negative and saturates around 0, or that there is some critical threshold above which, sorry dude, you’re just not going to get funded.
So, let’s do that analysis.

OK, first, I created two models – one which said if you asked for < $7500 (and it didn’t matter where in that gap the number was – could have been up to about $12000), success was drawn from some log-normal distribution (note the distribution of points and the fact that you cannot have negative success) with a mean determined by the data. If you asked for more, then, well, sure, you’re success was drawn from a log-normal distribution…with a mean of 0.
So that’s piece #1. Next, I fit a curve using a generalized linear model with a normal error distribution and a log link – so, preserving that log-normal distribution of error.
Which model will reign supreme? Doing a quick AIC analysis, the difference between the two is about 230, with the curve being the better predictor.
OK, fair enough – the curve wins! But does it matter?
So, we can look at the fit of the curve and see, yes, the coefficients are different from 0:
Coefficients:
              Estimate Std. Error t value Pr(>|t|)
(Intercept)  4.657e+00  1.973e-01  23.600  < 2e-16 ***
Goal        -2.236e-04  7.423e-05  -3.012  0.00425 **
---
Signif. codes:  0 ‘***’ 0.001 ‘**’ 0.01 ‘*’ 0.05 ‘.’ 0.1 ‘ ’ 1
We can even do a likelihood-ratio test and show, yeah, Goal matters
Analysis of Deviance Table (Type II tests)

Response: percent
     LR Chisq Df Pr(>Chisq)
Goal   12.672  1  0.0003712 ***
---
Signif. codes:  0 ‘***’ 0.001 ‘**’ 0.01 ‘*’ 0.05 ‘.’ 0.1 ‘ ’ 1
But…still, just look at the left-hand side of that graph. There is a HUGE amount of scatter around the fitted curve. The curve appears to be a really poor predictor in that <$7500 region, although it does give some information.
One metric that tells you something about your fit here is a comparison of the observed and predicted values. In particular, you can look at the proportion of the variance in observed values that is retained in the predicted values. Basically, a good olde R2 between observed and predicted values. And what is it? Well, in this case…0.2285.
Sad trombone. We’ve only explained about 23% of what’s going on in our data here. That’s a good chunk, but, eh, there’s clearly so much else going on – 77% of something else. Not only that, but, hey, even some of those high-goal projects did kinda ok, almost getting to half-way of their goal.
So what have we learned? Well, goal may matter in terms of your success if you are either asking for a very large or very small amount. But, it looks like there are other factors that are far more important for the middle ground. In particular, if you are asking for between $1250 and $7500, goal means almost nothing. Your success is determined by, well – stay tuned, and we’ll start testing other hypotheses – network size, online presence, and maybe even how those interact!
Or seed us with more ideas and hypotheses down in the comments! Oh, and for those who want some code-goodness (although no data – sorry!) see here.


“In particular, if you are asking for less than $7500, goal means almost nothing.”
EVERY project asking for less than $1,250 made its target, though — I think that’s the “almost” section of the data. The $1,250 to $7,500 may be the “nothing” section of the data.
YES! How could I miss that? This is why I’m so pleased to be posting this stuff. Note, I have updated the post appropriately and put a big fat update at the top. Thanks!
I’d note, though, that once you go above $1250, the next project only hit ~20%. So, I’d argue that folk who went for less than 1250 were probably doing more right than just having a small proposal.
It was interesting that while the RocketHub funding effort did not meet the original monetary goal of the project, additional supporters provided non-monetary support via offline means – resulting in our project’s success even with direct crowd-funding failure. The compute nodes are even now churning out CPU time for the WCG as part of the STEMulate Learning program. Similarly, participation in the #SciFund Challenge also provided sufficient visibility that a number of vendors provide samples of innovative materials (shape memory polymers and alloys, aerogel insulation, etc), which are provided excellent 2nd-order benefits to the STEMulate Learning program.
All in all, the #SciFund Challenge offered several opportunities to support scientific research:
1) Direct monetary support
2) Indirect support through montary or non-monetary gifts
3) Residual support from interest and recognition due to participation
My project succeeded in types #2 and #3, and was marginally successful in #1 (did not meet RocketHub goal but did receive sufficent fuel to move forward with reduced scope).
When Round #2 begins, a more focused and crowd-friendly set of objectives have already been identified from workshops conducted since the first round.
That is really cool – and something that Jai and I hoped would happen as part of the larger agenda behind #SciFund, but didn’t know to what extent #2 and #3 would succeed. That is absolutely fantastic!