
Ages ago, we posted the summary stats about R2 and R3 of #SciFund. But what about those big-arse surveys that we administered during R1? Did they tell the same story of engagement leading to crowdfunding? Or, was all of that just a fluke – an artefact – a total piece of melarky?
Wel, tldr; not only do we still see a signal of engagement, but, we see that engagement is enhanced by effort. Oh, and we actually don’t have the magic formula to predict Twitter followers. Sorry.
OK, so, let’s break it down.
The Survey
In the R2 and R3 survey, we asked all of the same questions (# followers, FB friends, etc.) EXCEPT – we realized that our questions regarding effort folk put into their campaigns were horrible. We asked folk to rate, on a Likert scale (1-5), how much effort they put into different activities. Problem was, one person’s 4 is another person’s 2. What we needed was real investment. So, this time around, we started asking “How many tweets did you put out? How many people did you contact by email? Etc.” Seriously. One of our questions was just, “Etc.” Very Zen and open to interpretation, no?
A little bit on methods
We used a number of quasipoisson GLMs with identity links again (except where we didn’t). Again, it’s count data, so, this seemed appropriate. Straight-up poisson was no good due to overdispersion, and NB models were inappropriate given the patterns we observed in the variance. So, we got model structure right in R1.
What was the same
Well, for starters, # of contributors = $$. Each contribution was ~$57, in line with the !$54 from round 1. This relationship explained ~83% of the variation, as opposed to 89% last time. So, right on.
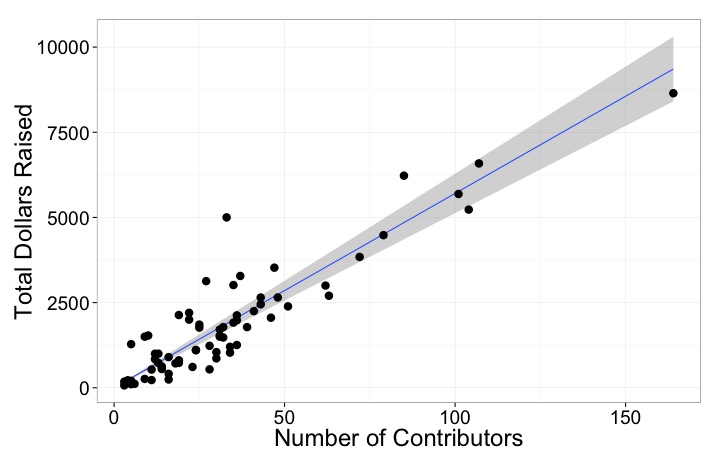
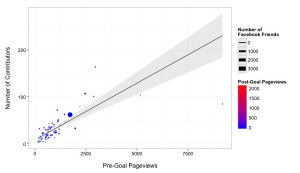
Facebook friends, and pre and post-Goal pageviews again all influenced number of contributors. What was interesting is that the pre-goal coefficient was a good bit higher – nearly double – while the post-goal coefficient was lower. But, in essence, 1 contributor per 100 Facebook friends (lower than before – I think your friends may be getting a bit inured to crowdfunding), while 25-50 page views = 1 contributor.
                  Estimate Std. Error t value Pr(>|t|)
(Intercept)           7.02       2.32    3.03     0.00
FacebookFriends       0.01       0.00    1.99     0.05
preGoalPageviews      0.02       0.01    6.59     0.00
postGoalPageviews     0.04       0.01    3.67     0.00
And…actually, a formal comparison says that pre and post-goal views are likely the same in terms of their effects on contributors (p=0.10). Only 62% of the variation in the response was retained by this model, as opposed to ~80% in R1. Could be our bigger sample size starting to play a bit of havoc, but, maybe not… Still, though, not a bad bit of explanation, as it were.
What was different?
I next re-ran the pre and post-Goal pageview models, trying to see how Facebook likes and twitter followers influenced both. In both cases, while Facebook likes were still at play there was no Twitter signal. Nada. p>0.2 for both.
And, well, Blogging activity no longer explained number of Twitter followers. This had been a weak result last time, so I wasn’t too surprised.
But, still, does audience size no longer matter? Zoot alors!
An honest science moment
OK, person reading this, come close. Come closer.
Hi.
How’s it going.
I have a science confession to make.
When I ran the above analyses and found that our Twitter signal got lost, my first response was to freak out a little bit on the inside. I mean, have we been wrong this entire time? Have I been talking out of my scientific butt? Or did I get something deeply and fundamentally wrong.
So I put the analysis down. Just, set it down. For a few weeks. I’d wake up in the morning, shower, and while in the shower, the analysis would come back into my brain and haunt me. Poke at me. Whap me on the head when I wasn’t looking.
This happens sometimes in science. You sit on a problem, an odd result. You gestate an idea coming from this seed of something shaking up your fundamental understanding about how the world works.
And then one morning I cracked open all of my notes on #SciFund and poured over reams of photos Jai, Zen, Barbara, and I had drawn. And there it was. The answer.
Effort
All of our early models had said that page views should be due to effort * audience size. During R1, we realized we asked a bad question regarding effort, so, as a first approximation, we fit audience size only models. When they worked, and worked beautifully, we danced for joy (well, I did) (in my chair) (well, ok, I may have gotten up and did a little dance). And then we all blissfully forgot about effort – except for Jai being smart enough to revise the survey for R2 and R3 to get better measures of effort. He included questions that didn’t focus on time or perception of effort, but rather, how much did a person actually put out there.
So, staring back at the data, I decided to run the following model – does total pageviews (as we’re not separating pre and post) equal a product of effort * audience size where you placed that effort.
Pageviews ~ # of G+ folk that follow you * # of G+ postings +
# of Twitter Followers * # of Tweets +
# of Facebook Friends * # of FB Posts +
Normal Blog Posting Frequency * # of Blog Posts +
# of people contacted via email +
# of press contacted.
It’s not perfect – we used posting frequency as a proxy for blog audience, which is an assumption (and we didn’t have readership stats). We also asked for total # of people contacted via email, which is already a combined number for email effort * email audience. And ditto for Press.
So what did we find? From this model, the three important things were Twitter, press contacts and email.
First, email. For every person contacted via email, there were ~ 2.13 page views. Multiplying through, every 20 emails = 1 donation (and, actually, I later fit a model putting emails directly into the contributor equation, and got just that, so, I’ll keep it in this pageview model for the moment). For every Tweet * Twitter Follower, there was roughly .02 page views. So, 50 Followers * 1 Tweet = 1 page view. Audience * Effort.
Let’s put this in perspective. I have 1,6008 Twitter followers. Assuming 50 page views were needed for one donation, and I was getting $58 per donation, and I tweeted once a day for 30 days – 1608*30*0.018812*.02*58 = $1052.
And last, Press. So, we finally have more measurements on press contact, aaaand – for every press person contacted, we have 83 page views. Now, there were a LOT of projects that got 0 coverage or made no effort to contact press folk. So, I view this with some suspicion. But, it does begin to give us some indication that outreach via press contacta may have some real legs here for science. Get people interested in putting the word out about your project!
Granted, there is still a lot unexplained – this only explains ~ 55% of the variation. But the relationships are there, and interesting.
Some wrap-up
In sum, I think we’ve learned here that effort * engagement = $$. We see it in Twitter. We see it in the number of press and email people contacted (which = effort * engagement) However, we still have a ways to go in explaining page views. We have yet to nail the X factor definitively, and perhaps it is time for us to march forward and begin characterizing project types, get a bigger sample size on press interactions and ask better questions than we have so far. But the central message of R2 and R3 is that building an audience alone is absolutely crucial. As you build it, engaging with them is one of the main keys towards a successful crowdfunding venture!
Hi Jarrett, excellent analysis! I had a couple of reactions/questions.
1) What is the donation turnout of the FB networks of projects leaders? In the Crowd4Discovery (C4D) campaign, I got 17% of my (~700) FB friends to donate. I have no idea if that’s a lot or a little. It would be great to know what the typical FB conversion rate is across many science crowdfunding campaigns.
2) Same question as #1 but for the Twitter follower networks of project leaders. In the C4D campaign I got 10% of my Twitter followers to turn out. Again, I have no idea what one should have expected.
3) As for press, I have solid evidence from several Microryza campaigns that press = $$. What I don’t know is why some press coverage results in stronger fundraising surges than others. So much can seemingly affect press impact, from link placement to whether a campaign is the sole focus of the story. Once the n is high enough, I’ll be able to make a model to explain how press-driven pageviews relate to donation surges (or lack thereof).
I absolutely agree that the community a scientist brings to the table is the major determinant of fundraising potential. But recent examples of what I call “locally sourced science” show that crowdfunding success can come as a result of activating issue-based communities that are not directly attached to a scientist.
We don’t actually have data on % of networks that contributed, as that would have required asking folk to do a great deal more legwork. We thought that would really shrink our sample size, so, no dice here. But, perhaps we can put it in as an optional question in the future for R4 (Jai?)
On the press front, I think next time we need to ask how many press articles of different types were released – not just # of press folk contacted. And, even better, if we can get URLs of those, we might be able to do some more digging and get at things like readership statistics, or quantify specificity (at least roughly) or an outlet. I’m guessing that you want to be covered either by a narrow-interest outlet or a mega-size outlet. Both are valid strategies. So, locally sourced or super-global. The in between may not be as valuable per capita, although may be valuable in terms of ability to get more coverage. So, three different strategies. But I could be wrong. I’m just turning anecdotes into hypotheses here.